Priya Lemos
Environmental Scientist
Turns satellite images and sensor data into a forest's report card — and a plan to help it grow back faster.
Day in the Life
Priya Lemos starts most days at her laptop before heading into the field — pulling up the latest satellite pass over a hillside that was clear-cut a decade ago and has spent the last four years under active reforestation. The satellite measures how green the land is using NDVI, a number built from how much red vs. near-infrared light the ground reflects (healthy leaves bounce back a lot of near-infrared). Year over year, this hillside’s NDVI map has been creeping from “bare dirt brown” toward “forest green,” patch by patch.
By mid-morning she’s out on that hillside with a small crew, doing the ground-truth work satellites can’t: measuring trunk diameter and height on a sample of planted trees, logging survival rates, pulling soil samples. The numbers feed one big question — roughly how much carbon dioxide this forest is pulling out of the air and locking into wood and soil this year. Not just academic. It’s how the project proves its progress against the climate targets that funded it in the first place.
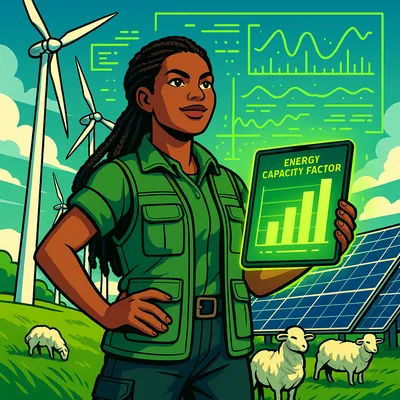
In the afternoon Priya switches gears completely — a ridge where wind turbines and solar panels share the land with grazing sheep. Her job: audit capacity factor, how much electricity these turbines and panels actually produced this month against what they’d produce running full-out, 24/7. Wind and sun aren’t constant, so this number always lands well under 100% — but tracking it over time tells the operators whether a turbine needs maintenance, or a calm month was just weather.
Good environmental science isn’t just measuring problems, she likes to say. It’s measuring what’s working, so you can do more of it.
Back at her desk, it all becomes one report: forest growth trending up, carbon capture for the quarter, energy output from the renewables site, and a short list of recommendations — this month, moving up the planting schedule for a section that’s recovering faster than projected.
The Science
The carbon cycle and carbon sequestration
Carbon moves continuously between the atmosphere, oceans, soil, and living things — the carbon cycle. Plants pull CO₂ out of the air through photosynthesis, using sunlight to convert CO₂ and water into sugars (which become wood, leaves, and roots) and oxygen. When a forest grows, it’s storing — or sequestering — carbon that was previously in the atmosphere, in its trunks, branches, roots, and the soil around them. This is exactly what Priya’s growth measurements are tracking: tree volume converts (via known wood-density and carbon-fraction figures) into an estimate of tons of CO₂ removed from the atmosphere.
The greenhouse effect
Sunlight (mostly visible light) passes through the atmosphere and warms Earth’s surface. The surface re-radiates that energy as infrared radiation (heat). Certain gases — notably CO₂, methane, and water vapor — are mostly transparent to incoming sunlight but absorb and re-emit infrared radiation, trapping some of that heat rather than letting it escape directly to space. This greenhouse effect is natural and necessary (without it, Earth would be far colder) — the concern is that adding more of these gases increases how much heat gets trapped, raising the average global temperature.
Capacity factor — and why renewable output isn’t constant
A power plant’s capacity factor is its actual output over a period divided by its maximum possible output if it ran at full rated power the entire time:
$$\text{capacity factor} = \frac{\text{actual energy produced}}{\text{rated power} \times \text{time}}$$
A solar panel rated at 100 kW that produces an average of 25 kW over a day has a 25% capacity factor — not a flaw, just physics (the sun isn’t directly overhead all day, and isn’t out at night). Wind turbines depend similarly on how often and how strongly the wind blows. Comparing capacity factor month-to-month — rather than judging a single day — is how Priya can tell normal variability from an actual equipment problem.
Exponential growth and recovery curves
Early in a reforestation project, growth often looks roughly exponential — each tree adds a percentage of its own size each year, so absolute growth accelerates as trees get bigger — before eventually leveling off (an “S-curve”) as the forest matures and competition for light and nutrients increases. Recognizing which part of that curve a project is on is part of what lets Priya forecast next year’s numbers from this year’s.